
Activity vs. Outcome: Stop Measuring How Much AI You Use
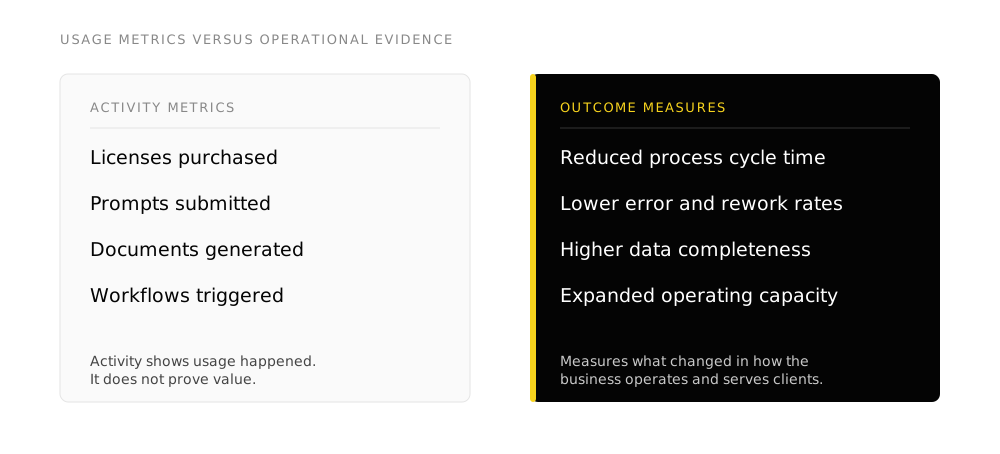
Organizations find it easy to count software activity. It takes minutes to collect vendor metrics: licenses provisioned, employees trained, prompts submitted, words generated, workflows triggered, and bots configured.
These volume metrics demonstrate that software is accessible and active. They provide almost no evidence that operational performance has improved.
A business can double its volume of generated marketing collateral without booking an incremental dollar of revenue. An operations team can trigger thousands of automation runs without shortening client delivery timelines. An enterprise can deploy generative copilots to five hundred employees while staff spend more time reviewing, correcting, and re-formatting outputs than they previously spent doing the work manually.
Activity indicates that technology is running. Operational outcomes prove that the business has improved.
TL;DR
- Activity metrics measure consumption, not business return: Counting prompt volume or license seats reflects vendor utilization rather than operating efficiency.
- Automating broken workflows accelerates disorganization: Triggering an automated sequence across a flawed process simply produces errors and friction faster.
- Establish an operational baseline first: Quantify cycle time, manual touchpoints, error rates, and wait times before deploying new automation tools.
- Evaluate progress across four distinct tiers: Track adoption, process efficiency, deliverable quality, and core business outcomes.
- Account for hidden verification costs: Calculate net productivity by subtracting the time required to review, verify, and correct AI outputs from the gross generation speed.
The trap of proxy metrics in enterprise technology
Over-indexing on activity is not unique to artificial intelligence rollouts. Technology programs have historically relied on proximate consumption metrics:
- CRM initiatives measured by the volume of records created
- Team collaboration software evaluated by daily active users
- Knowledge management platforms judged by document upload counts
- Corporate learning programs scored by course completion percentages
Companies collect these metrics because they are readily accessible inside vendor administration dashboards. Yet businesses do not invest capital in technology platforms simply to generate records or trigger API events. They invest to achieve specific operational improvements:
- Accelerating sales pipeline velocity and forecast precision
- Eliminating missed steps in customer onboarding
- Reducing support resolution cycle time while maintaining customer satisfaction
- Increasing service delivery capacity without linear headcount expansion
Those are the operational benchmarks that justify technology investment. For an analysis of how consumption metrics misrepresent real organizational change, see Implementation vs. Adoption.
Automating broken processes accelerates friction
When an organization automates an inefficient workflow, the result is faster inefficiency.
Consider an internal approval chain that requires four redundant signatures because nobody established clear budget thresholds. Automating notifications does not resolve the structural bottleneck; it simply bombards managers with automated alerts more frequently. Introducing an AI agent that drafts automated reminders merely accelerates the confusion.
Before automating a process or introducing machine reasoning, evaluate whether the process itself warrants existence in its current form. Process clarity must precede technological acceleration. For an architectural framework on designing systems before adding software, read Tools vs. Systems.
Establish the operational baseline before deployment
A rigorous automation project starts with an objective baseline:
- How many hours does the workflow currently require from initiation to delivery?
- How much manual data manipulation is needed across platforms?
- Where do handoffs stall, and what causes work to wait?
- What is the historical error, rework, or dispute rate?
- What does it cost the business to execute the workflow manually?
Without a baseline, leadership cannot determine whether a new tool produced measurable business value or simply generated technological enthusiasm.
Consider an account management team preparing for quarterly executive reviews. Before automation, an account manager spends forty-five minutes collecting data across the CRM, billing platform, and project management software. Critical commitments are regularly omitted because records sit in separate databases.
After implementing an integrated system, data is compiled automatically in five minutes, providing an authoritative summary of account health, outstanding deliverables, and commercial renewal milestones.
That is tangible operational value: forty minutes returned per account, combined with higher data accuracy. Reporting that “employees submitted six hundred AI prompts” is secondary administrative detail.
The net productivity equation
Net Productivity = (Time saved generating output) - (Time spent compiling context + Time spent verifying and correcting output + Time spent resolving errors). If verification and context gathering take longer than manual execution, the automation produces negative net productivity.
The four-tier operational measurement framework
To evaluate digital systems accurately, structure measurement across four progressive levels:
1. Adoption
Verifying that employees actively use the platform as intended. Metrics include process compliance, percentage of eligible transactions flowing through the system, and retirement of offline spreadsheets.
2. Efficiency
Measuring resource reduction across the operating sequence. Metrics include cycle time reduction, eliminated manual keystrokes, decreased queue time, and transaction processing cost.
3. Deliverable quality
Assessing whether the work product improved. Metrics include reduced error and rework rates, higher data completeness, consistent adherence to compliance standards, and customer satisfaction scores.
4. Business outcomes
Tracking the commercial impact of the operational improvement. Metrics include expanded fulfillment capacity, increased customer retention, faster time to revenue, and reduced operational liability.
Not every workflow will link directly to top-line revenue growth. Many systems exist to mitigate compliance risk or stabilize operational capacity. The requirement is defining the specific operational outcome the architecture was engineered to deliver.
Account for the hidden friction of AI generation
Generative systems can create local speed while shifting friction downstream into other departments:
- An AI system drafts customer proposals in seconds, but legal spends an extra hour reviewing them for inaccurate commitments.
- Customer support agents use generative responses, but senior engineers must review technical explanations for hallucinations.
- A software development team uses automated code generators to commit code faster, but quality assurance spends twice as long debugging complex regressions.
Gross activity increased; net operational efficiency deteriorated. A comprehensive measurement system evaluates the entire lifecycle of the deliverable:
- Where did manual effort actually move?
- How much supervisory overhead was created to verify automated drafts?
- What new compliance and operational risks were introduced?
A local optimization that introduces systemic friction represents an architectural failure. For guidance on structuring authority boundaries to prevent these review bottlenecks, consult Assistance vs. Autonomy.
- Relying on vendor usage dashboards as proof of business transformation
- Automating a convoluted, undocumented workflow without first simplifying the process
- Deploying AI tools without measuring baseline cycle times and error rates
- Ignoring the time required for employees to review and correct generated drafts
- Treating high prompt counts as evidence of operational productivity
Frequently asked questions
Why are prompt counts poor indicators of AI success?
Prompt counts measure conversational activity between an employee and a language model. They do not indicate whether the interaction produced accurate work, shortened cycle times, or eliminated manual business steps.
What operational metrics best evaluate AI automation?
The most reliable metrics are process cycle time reduction, error and rework rates, data completeness scores, and transactional cost savings relative to an established pre-deployment baseline.
How do we identify whether AI is creating hidden review costs?
Track the time required for senior staff to audit, verify, and correct AI outputs. If supervisory review hours increase significantly after deployment, the system is shifting work rather than eliminating it.
How does Begine Fusion structure outcome-focused systems?
Begine Fusion identifies the specific operational bottlenecks in your business, maps the required data architecture through FusionMap, and builds workflows engineered to deliver verifiable operational returns through Systems Build.
Takeaways
- Activity metrics track software consumption; operational outcomes measure economic and operational value.
- Automating an unexamined process accelerates organizational friction rather than improving performance.
- Establish an objective operational baseline across cycle time, manual touchpoints, and error rates before deploying tools.
- Evaluate technology rollouts across four tiers: adoption, efficiency, quality, and business outcome.
- Measure net productivity by accounting for the time required to format context and verify automated deliverables.